

Instagram Analytics for Business: A Small-Business Guide
Instagram Insights give you a direct read on which posts, formats, and posting times actually drive awareness, leads, and sales. The core verdict: Instagram Insights show who sees and engages with your content, which content drives profile visits, and which drives website clicks. Map two business KPIs right now: awareness (track accounts reached and impressions) and conversions (track website taps and CTA taps). You can do this in the next 30 minutes.
Three immediate actions to take today:
- Switch to a Professional account (Business or Creator) if you have not already. Without it, Insights are not available.
- Open Account Insights and set the date range to the last 30 days.
- Screenshot your “Top content” and “Profile activity” sections. This is your baseline. Every optimization decision you make going forward starts here.
One important expectation to set: Insights data refreshes every 24 hours and is available in 7, 14, 30, and 90-day preset windows. You will not get raw user identities, and you cannot export a full historical dataset directly from the app. Work within those limits and you will still have more than enough to make smart decisions.
Table of Contents
- How to access Instagram analytics for business accounts
- Key Instagram metrics every small business should track
- How to read post, Reel, Story, and Live metrics to choose the right format
- Interpreting follower demographics, active times, and growth trends
- Measuring conversions and ROI: when to use Insights vs. Ads Manager
- Exporting data, connecting to Meta Business Suite, and using third-party dashboards
- Common limitations, data discrepancies, and quick troubleshooting steps
- How to turn Insights into a repeatable weekly optimization routine
- How to track competitor Instagram accounts and industry benchmarks
- Key Takeaways
- What actually matters first, second, and third
- Photofy helps you move from Insights to execution faster
- Useful sources for deeper reading
How to access Instagram analytics for business accounts
Getting into Insights takes less than two minutes once your account is set up correctly. Here is the exact path.
Setting up a Professional account
- Go to your Instagram profile and tap the three-line menu in the top right corner.
- Tap “Settings and privacy,” then scroll to “Account type and tools.”
- Select “Switch to professional account” and choose “Business” when prompted.
- Enter your business contact information and link your Facebook page if you have one.
Once you are on a Professional account, the full Insights dashboard becomes available at no cost.
Finding Insights in the app
- From your profile, tap “Professional dashboard” near the top of the page.
- Tap “Account insights” to open the overview screen.
- Use the preset date range selector (7, 14, 30, or 90 days) to set your reporting window.
- Tap into any metric card for a detailed breakdown, including demographic data and content-level performance.
For post-level data, open any post, tap the three dots or swipe up, and select “View Insights.” You will see discovery source breakdown and actions tied to that specific post, including profile visits and website taps.
When to use Meta Business Suite or Ads Manager instead
- Meta Business Suite: Use it for a cross-account overview, desktop access, and basic data exports (PNG, CSV, or PDF). It gives you a broader view of your profile performance at a glance and is useful for weekly reporting.
- Meta Ads Manager: Use it when you are running paid campaigns and need attribution data, conversion tracking, and ROAS measurement. Insights alone cannot close the loop on paid spend.
Pro Tip: Screenshot your monthly recap and top content list at the end of every month before the data rolls out of the 90-day window. A simple folder of monthly screenshots becomes a lightweight performance archive.
Key Instagram metrics every small business should track
Knowing which numbers to watch, and what to do when they move, separates businesses that grow on Instagram from those that post and hope.

| Metric | What it measures | One action to take |
|---|---|---|
| Accounts reached | Unique accounts that saw your content at least once | Compare to follower count; a large gap means non-followers are finding you |
| Impressions | Total times your content appeared on screen | High impressions vs. low reach = repeat views from the same people (positive signal) |
| Profile visits | How many people tapped through to your profile | Low visits despite high reach = weak hook or unclear content purpose |
| Website taps | Clicks on the link in your bio | Low taps despite high profile visits = fix your bio CTA and landing page |
| Saves | Content bookmarked for later | High saves = high-intent audience; repurpose this content into a lead magnet |
| Shares | Content sent via DM to others | High shares = strong social proof; prioritize similar content for paid promotion |
| Accounts engaged | Unique accounts that interacted with your content | Track the follower vs. non-follower split to gauge content discovery |
| Follower growth | Net follower change over the selected period | Requires 100+ followers to display; track weekly for trend direction |
A few definitions worth locking in: impressions count every time your content appeared on screen, including multiple views by the same person. Reach (or accounts reached) counts unique accounts only. If your impressions are three times your reach, the same people are coming back to your content, which is a positive signal for the algorithm.
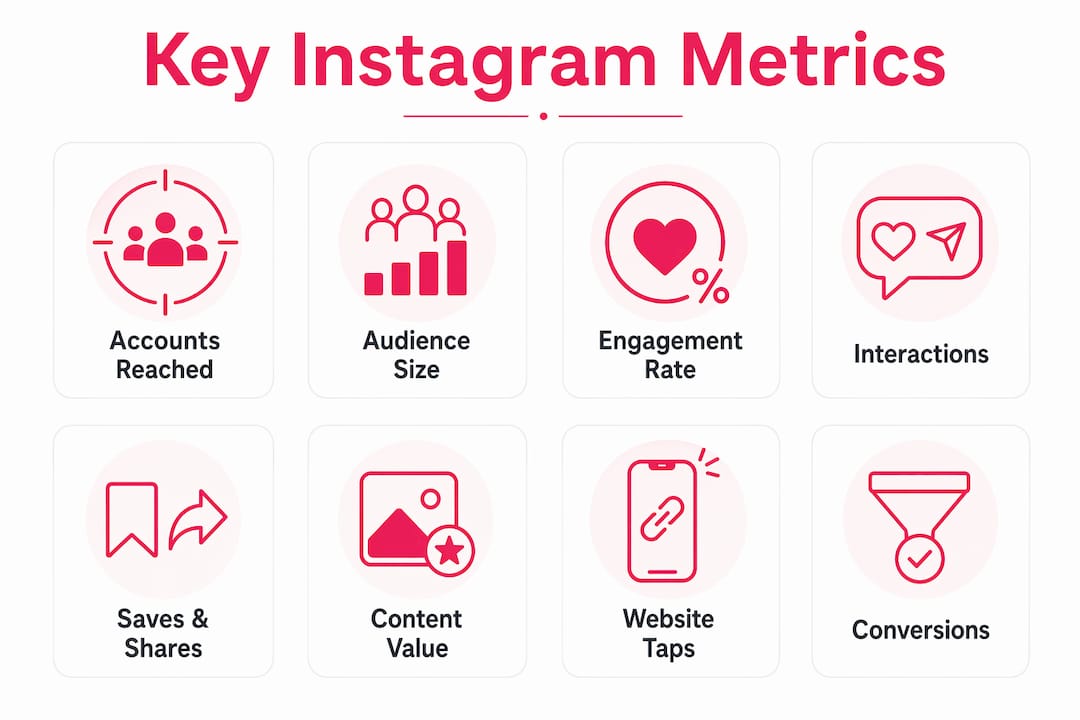
Engagement rate per post is calculated as: (likes + comments + saves + shares) ÷ accounts reached × 100. For small business accounts, many consider a rate above a low single-digit percentage a reasonable benchmark to aim for, though this varies by industry and account size.
Two high-value signals that small businesses often underweight: saves and shares. A save means someone found your content worth returning to. A share means they sent it to someone else. Both carry more intent than a like, and both are signals the algorithm uses to expand distribution. If a post earns high saves, consider turning that content into an email capture lead magnet or a pinned post.
Conversely, if you are seeing high reach with low website taps, the problem is almost never the content. It is usually the bio CTA or the landing page. Fix the link and the copy around it before creating more content.
How to read post, Reel, Story, and Live metrics to choose the right format
Not every format serves the same goal. Choosing the right one for each objective is one of the fastest ways to improve your results without posting more often.

| Format | Best for | Key metrics to watch | Typical weakness |
|---|---|---|---|
| Reels | Reach and discovery | Watch-through rate, shares, accounts reached | Lower save rate than carousels |
| Carousels | Saves and depth | Saves, swipe-through rate, profile visits | Slower to reach non-followers |
| Single image | Brand clarity and announcements | Impressions, profile visits | Limited engagement depth |
| Stories | Relationship-building and CTA taps | Taps forward/back, exits, replies, link taps | Disappears after 24 hours |
| Live | Deep engagement and Q&As | Peak concurrent viewers, comments, shares | Requires real-time availability |
For Reels, the single most important metric is average watch time. If your average watch time is below 3 seconds on a 30-second Reel, the opening frame is not working. Test a different hook, not a different topic. Shares are the highest social proof signal on Reels; if your share count is climbing, that content is worth putting paid spend behind.
For Stories, the drop-off between frames tells you exactly where you are losing people. If frame 1 has 1,000 views and frame 5 has 200, something in the middle is not holding attention. Exits are the metric to watch. Replies and sticker interactions (polls, questions, link taps) are your conversion signals in Stories.
On hashtags: Instagram capped hashtags at five per post in December 2025. The current best practice is 3–5 highly relevant tags used as classification signals, not volume discovery tools. For accounts under 100,000 followers, placing hashtags in the caption tends to increase reach. The algorithm now relies far more on watch time, saves, shares, and keyword-rich captions than on hashtag volume.
Pro Tip: Take your highest-performing Reel and repost it as a Story with a “swipe up” or link sticker CTA. Then test the same content with a different opening frame as a new Reel. You get two data points from one piece of content.
Interpreting follower demographics, active times, and growth trends
Your audience data is one of the most underused sections in Insights. It tells you not just who is following you, but whether you are reaching the right people at the right time.
To find it, go to Account Insights, tap “Total followers,” and scroll through the breakdown. You will see:
- Top locations: Cities and countries where your followers live
- Age range: Distribution by age bracket
- Gender: Percentage split
- Most active times: A bar chart showing peak activity hours by day
Actionable rules for using this data:
- Test posting during your top two active-hour windows for one week. Compare reach and engagement to your baseline from the previous week. If one window consistently outperforms, anchor your content calendar there.
- If your top city is not where your business operates or serves, you have an audience mismatch. This usually means your content is attracting interest from a demographic that is not your buyer. Adjust your content topics, language, and location tags to pull in the right geography.
- Use city-level spikes to run localized promotions. If a specific city shows up repeatedly in your reached accounts, a geo-targeted Story or a local hashtag set can amplify that signal.
A short checklist for your content calendar adjustments:
- [ ] Identify your top two active-hour windows and schedule posts there for two weeks
- [ ] Check whether your top cities match your target market; adjust content if they do not
- [ ] Review age and gender data quarterly to confirm your content is reaching your intended buyer
- [ ] If follower growth is flat but reach is climbing, your content is reaching non-followers who are not converting; test a stronger follow CTA
Pro Tip: Pull two months of post data and group by 2-hour posting windows. The window that consistently outperforms is your sweet spot. Do not rely on the “most active times” chart alone; validate it against actual post performance.
Measuring conversions and ROI: when to use Insights vs. Ads Manager
Native Insights can show you profile website taps and CTA taps. That is useful for organic content. It is not enough for measuring paid campaign ROI or full-funnel conversion tracking.
Here is a simple workflow for small businesses:
- Tag every campaign link with UTM parameters. Use Google’s Campaign URL Builder to create UTM-tagged URLs for your bio link, Story link stickers, and any paid ad destinations.
- Use Meta Ads Manager for paid attribution. Ads Manager tracks conversions using the Meta Pixel and gives you cost-per-result, ROAS, and cross-touch attribution data that Insights cannot provide.
- Use Insights for organic signal and creative testing. When a piece of organic content earns high saves, shares, or website taps, that is your signal to put paid spend behind it. Insights tells you which creative to promote; Ads Manager tells you what it cost and what it returned.
What native Insights cannot do:
- Track purchases or leads beyond the tap on your bio link
- Attribute conversions across multiple touchpoints
- Show you which ad creative drove a sale
A warning on discrepancies: Insights and Ads Manager will often show different numbers for the same metric. This happens because they use different attribution windows, different deduplication methods, and data that updates at different times. Do not try to reconcile them exactly. Use Insights for organic trends and Ads Manager for paid performance, and treat them as separate lenses on the same account.
Exporting data, connecting to Meta Business Suite, and using third-party dashboards
Instagram Insights does not offer a raw data export from within the app, and historical data is only available for the past 90 days. That is a real constraint for any business trying to do year-over-year analysis or build a reporting archive.
Here is how to work around it:
- Screenshot or manually record key metrics weekly. Capture reach, impressions, top posts, and website taps every week before the data ages out.
- Connect your Instagram account to Meta Business Suite. From Business Suite, you can export data as a PNG, CSV, or PDF. You gain access to a broader view of your profile performance and can manage both Instagram and Facebook from one dashboard.
- Link your Facebook page. This is required to unlock the full range of Business Suite features. Go to Settings in the Instagram app and connect your Facebook page under “Linked accounts.”
- Consider a third-party analytics tool when you need competitor benchmarking, multi-platform reporting, or automated exports. These tools pull data via the Meta API and can store historical data beyond the 90-day in-app window.
Fields to capture in your weekly snapshot:
- Accounts reached (total and follower vs. non-follower split)
- Impressions
- Top 3 posts by reach and by saves
- Website taps
- Net follower change
Required permissions checklist before connecting to Business Suite:
- [ ] Instagram account is set to Professional (Business or Creator)
- [ ] Facebook page is linked to the Instagram account
- [ ] You are an admin on the Facebook page
- [ ] Business Suite access is granted to your business account
Common limitations, data discrepancies, and quick troubleshooting steps
Knowing the platform’s limits ahead of time saves you from chasing phantom problems in your data.
Known limitations:
- In-app data window is capped at 90 days; there is no way to extend it natively
- Data refreshes every 24 hours, so same-day changes will not appear immediately
- Some metrics (such as shares counts) are geo-restricted and unavailable in certain regions
- Insights do not show individual viewer identities; you see aggregate counts only
- The “Total followers” breakdown requires at least 100 followers to display
Common discrepancies vs. Ads Manager and third-party tools:
- Different attribution windows (Insights uses a shorter default window than Ads Manager)
- Different deduplication methods for reach and engagement counts
- Delayed updates mean the same metric can show different values depending on when you check each platform
Troubleshooting steps:
- Confirm your account is set to Professional (Business or Creator), not Personal.
- Verify your Facebook page is correctly linked under “Linked accounts.”
- Allow 24–48 hours for new data to appear before assuming a metric is broken.
- If a metric shows a sudden spike or drop, document the date and check whether a post went viral, a paid campaign ran, or a platform update occurred before attributing it to creative performance.
Quick checklist for reporting anomalies:
- [ ] Check account type and permissions first
- [ ] Verify Facebook page link is active
- [ ] Wait 48 hours before escalating
- [ ] Document any unusual spikes with date and context
- [ ] If the issue persists, contact Meta Business Support through the Help Center in Business Suite
How to turn Insights into a repeatable weekly optimization routine
The most common mistake businesses make with Insights is treating metrics as raw numbers rather than signals to design tests tied to revenue or leads. Here is a workflow that fixes that.
Weekly workflow
- Capture baseline. Every Monday, record reach, impressions, website taps, saves, and shares for the past 7 days.
- Hypothesize. Pick one variable to test: a different posting time, a new content format, or a different caption style.
- Design two controlled tests. Run two posts that are identical except for the one variable you are testing. Keep the topic, length, and CTA the same.
- Run for one week. Let both posts collect data before drawing conclusions.
- Compare to baseline. Did reach increase? Did website taps go up? Did saves improve? Pick the winner based on the metric tied to your current KPI.
- Iterate. Apply the winning variable to your next two posts and test a new variable.
Monthly review checklist
- Awareness KPI: Did accounts reached increase month over month?
- Consideration KPI: Did profile visits and website taps trend up?
- Conversion KPI: Did UTM-tagged traffic from Instagram increase in your analytics platform?
- Content mix: Which format earned the most saves and shares? Shift your calendar toward it.
- Audience health: Did follower growth keep pace with reach growth?
A practical example of this in action: a small retail shop tested Reels vs. carousel posts over six weeks, measuring saves and website taps as the primary signals. Reels drove significantly higher reach, while carousels earned more saves. The shop began using Reels for discovery and carousels for product education, then used the high-save carousels as the basis for an email capture campaign. Website taps doubled over the six-week period.
Pro Tip: Test one variable at a time and always prioritize high-intent signals (saves and website taps) when deciding which content wins. Reach tells you how far your content traveled; saves and taps tell you whether it moved anyone to act.
For your hashtag testing, audit your last 10 posts and compare reach across different tag sets. Remove any banned or oversaturated tags and adopt a 3–5 tag framework with a rotating fifth tag. Track which combinations drive the most impressions from hashtags in your post-level Insights.
How to track competitor Instagram accounts and industry benchmarks
Instagram Insights only shows data from your own account. To understand how your performance compares to competitors or industry standards, you need a different approach.
What you can do natively:
- Manually review competitor profiles to observe their posting frequency, content formats, and engagement patterns. Count likes and comments relative to their follower count to estimate their engagement rate.
- Use Instagram’s search and explore features to identify which content formats and hashtags are performing well in your category.
- Track hashtag pages for your niche to see which content ranks in the top posts, which signals strong engagement relative to the tag’s volume.
Where third-party tools add value:
Native Insights cannot benchmark your performance against competitors. Third-party analytics platforms fill this gap by pulling public data via the Meta API and presenting it alongside your own metrics. When evaluating these tools, look for:
- Competitor follower growth tracking over time
- Engagement rate benchmarks by industry and account size
- Hashtag performance analytics across multiple accounts
- Automated weekly or monthly reports
A practical benchmarking approach without paid tools:
Build a simple spreadsheet. Every two weeks, visit five competitor accounts and record their follower count, average likes per post (based on their last 10 posts), and average comments per post. Calculate their estimated engagement rate and compare it to your own. Over three months, you will have a clear picture of where you stand relative to your category.
For industry benchmarks, published reports from social media research organizations provide average engagement rates by industry. These give you a reference point for whether your numbers are strong, average, or below par for your sector, without needing a paid tool.
The algorithm’s distribution signals in 2026 are watch time, saves, shares, and DMs. When you benchmark competitors, pay attention to which of their posts earn the most comments and shares. Those are the formats and topics your category’s audience responds to most, and that is the intelligence that should shape your content calendar.
Key Takeaways
Instagram analytics for business deliver the most value when you map specific Insights metrics to two business KPIs and run controlled tests weekly rather than tracking every number at once.
| Point | Details |
|---|---|
| Map metrics to KPIs | Track accounts reached for awareness and website taps for conversions; measure both weekly. |
| Prioritize high-intent signals | Saves and shares indicate stronger buyer intent than likes; use them to pick content winners. |
| Separate organic and paid measurement | Use Insights for creative testing and organic trends; use Ads Manager with UTM tags for paid attribution. |
| Capture data before it expires | The in-app window is 90 days; screenshot or export weekly snapshots to build a performance archive. |
| Photofy for execution | Photofy’s templates, scheduling, and content calendars help you act on Insights data without losing momentum between analysis and posting. |
What actually matters first, second, and third
Most small businesses come to Instagram analytics looking for the one metric that explains everything. There is not one. But there is a clear order of operations that makes the whole system work.
First priority: set two business KPIs and capture a 30-day baseline. Not five KPIs. Two. Awareness (accounts reached) and conversions (website taps or UTM-tracked leads). Everything else is context. Without a baseline, you have no way to know whether anything you change is working.
Second priority: run two small format tests. A Reel against a carousel, same topic, same week. Measure saves and website taps, not likes. Likes are easy to get and hard to act on. Saves and taps tell you whether your content is moving people toward a decision. This is where most businesses find their first real insight: the format they assumed was working often is not the one driving conversions.
Third priority: integrate Insights signals into your content planning. Once you know which formats and topics earn the highest saves and website taps, build those into a repeatable content calendar. Free content calendars from Photofy are a practical starting point for embedding your weekly test plans into a structured schedule.
As your account grows, the routine scales with it. You add more format tests, layer in paid amplification for your top organic performers, and eventually connect to Meta Business Suite or a third-party tool for deeper reporting. But the foundation stays the same: two KPIs, weekly snapshots, one test variable at a time.
Photofy helps you move from Insights to execution faster
Reading your Insights is only half the work. The other half is producing the right content, on time, in the right format, consistently. That is where most small businesses stall: the gap between knowing what works and actually publishing it.
Photofy closes that gap. The platform gives you pre-designed templates built for the formats that perform best on Instagram — Reels, carousels, Stories, and single-image posts — so you can move from an Insights finding to a finished, on-brand post in minutes, not hours. Scheduling tools let you align your publishing calendar with your followers’ most active times, and the built-in content calendar structure makes it easy to plan your weekly test pairs without losing track of what you are testing.
For teams and franchises, Photofy’s white-label options mean every team member publishes content that stays on-brand, even when they are working independently. Whether you are a solo operator or managing content across multiple locations, the platform fits your workflow.
Start with Photofy to put your Insights findings to work. If you want a ready-made planning tool, grab a free content calendar and start scheduling your next round of format tests today.
Useful sources for deeper reading
The sources below are the most reliable references for the technical details covered in this guide. Each one is best suited to a specific follow-up task.
- Instagram Insights help page (Meta): The official source for metric definitions, account requirements, and data availability. Start here when you need to verify a specific metric’s definition or check whether a feature is available in your region.
- Shopify’s Instagram Insights guide: Covers setup, metric explanations, and practical use cases for business accounts. Best for readers who want a step-by-step walkthrough of the Insights dashboard with business-focused examples.
- HubSpot’s guide to Instagram Insights for small businesses: Focuses on tying metrics to business outcomes and running a test-driven content strategy. Best for readers who want workflow examples and goal-setting frameworks.
- CreatorTribune’s Instagram hashtag strategy guide: Covers the 5-hashtag cap, placement strategy by account size, and a testing framework for rotating tag sets. Best for readers optimizing their discovery signals alongside content quality.
- ManyChat’s Instagram hashtag strategy for 2026: Explains how the algorithm weights engagement signals over hashtag volume and how to build content that earns watch time, saves, and shares. Best for readers who want to understand the current distribution mechanics.
“The brands that grow on Instagram in 2026 build content quality, watch time, save rate, and share rate first, with hashtags as a supporting signal. The brands that lead with hashtag strategy and hope content quality follows tend to underperform.” — Conbersa, What Is the Best Instagram Hashtag Strategy in 2026?