

Marketers: Use Photofy Templates to Turn Social Metrics Into Decisions
Social media analytics is the practice of collecting and interpreting platform data to answer a specific business question, then acting on the answer. The single most important thing you can do with it is tie every metric you track to a real KPI, not a vanity number. Start there: pick one core metric this week, then adopt a reporting cadence you’ll actually stick to.
TL;DR:
- Most teams should focus on descriptive and diagnostic analytics before attempting predictive or prescriptive insights to ensure data reliability.
- Metrics like reach, engagement rate, and click-through rate must be paired with context and clear goals to drive meaningful decisions.
- Building consistent reports with clear goals, platform breakdowns, and actionable recommendations is key to influencing strategic and budget choices.
- Automated data collection via connectors and proper tagging enhances accuracy and saves time, especially for teams managing multiple platforms.
- Recognizing platform algorithm changes and attribution challenges helps set realistic expectations for what social media analytics can reveal.
Table of Contents
- What Is Social Media Analytics, and How Does It Mature Over Time?
- Why Does Social Media Analytics Matter for Business Outcomes?
- Which Social Media Metrics Actually Matter?
- How Do You Build an Effective Social Media Report?
- What Tools and Workflows Support Social Media Analytics?
- How Do You Turn Metrics Into Decisions?
- What Advanced Capabilities Should Mature Teams Consider?
- Where Can Marketers Find Ready-Made Analytics Resources?
- How Do You Collect Reliable Social Media Data?
- What Are the Biggest Limitations of Social Media Analytics?
- What Should Lean Teams Prioritize First?
- Ready to Close the Loop From Content to Report?
- Sources
What Is Social Media Analytics, and How Does It Mature Over Time?
Most teams start by counting things and end by predicting things. That progression has a name: the analytics maturity ladder, and it runs from descriptive to diagnostic to predictive to prescriptive. Each rung answers a harder question, and each requires more data discipline than the one before it.
Descriptive analytics answers “what happened?” It’s your follower count last month, your average engagement rate on Reels, your total impressions for a campaign. This is where almost every brand dashboard lives, and for good reason. It’s fast, it’s cheap to produce, and it gives you a baseline. The output looks like a chart: a line trending up or down, a bar comparing platforms.
Diagnostic analytics answers “why did it happen?” If engagement dropped 15% in March, diagnostic work digs into posting times, content mix, and audience overlap with a competitor’s campaign to find the cause. The output isn’t a single number. It’s a short narrative, usually built by segmenting descriptive data by variable (day of week, format, creator, hashtag set) until a pattern surfaces.
Predictive analytics answers “what’s likely to happen next?” This is where you use historical engagement patterns to forecast which content types will perform in an upcoming launch, or model expected reach for a paid boost based on past campaigns. Few marketing teams do this well without a data analyst on staff, but even simple trend extrapolation counts.
Prescriptive analytics answers “what should we do about it?” It’s the rarest and most valuable tier. Instead of a forecast, you get a recommendation: shift 20% of budget from Facebook to TikTok next quarter because engagement-per-dollar has been climbing for three consecutive months. Few platforms deliver this automatically. Most teams build it manually by pairing predictive output with a decision framework.
Here’s how the four levels stack up in practice:
- Descriptive: “We posted 40 times and got 2 million impressions.” Easy to produce, easy to misuse as a vanity metric.
- Diagnostic: “Impressions dropped because we cut video posts by half.” Requires cross-referencing content type against performance.
- Predictive: “Based on the last two quarters, expect a 10% to 15% lift from increasing video frequency.” Needs enough historical volume to trust the pattern.
- Prescriptive: “Reallocate two video posts per week from Facebook to Instagram Reels based on cost-per-engagement trends.” Needs both a model and a willingness to act on it.
Most small teams should not chase predictive or prescriptive analytics until descriptive and diagnostic reporting is consistent and trusted. Jumping to forecasting on shaky baseline data just produces confident-sounding guesses.
Why Does Social Media Analytics Matter for Business Outcomes?
Analytics matters because it’s the only mechanism that connects content output to revenue-relevant outcomes: awareness, acquisition, retention, and product feedback. Without it, social media becomes a content treadmill with no way to know if the effort is working.
Awareness metrics tell you whether your content is reaching new audiences. Acquisition metrics tell you whether that reach converts into leads or customers. Retention metrics, often overlooked, tell you whether your existing community stays engaged over time rather than churning after a single campaign. And comment sections, DMs, and reaction patterns double as an informal product feedback channel that many brands ignore entirely.
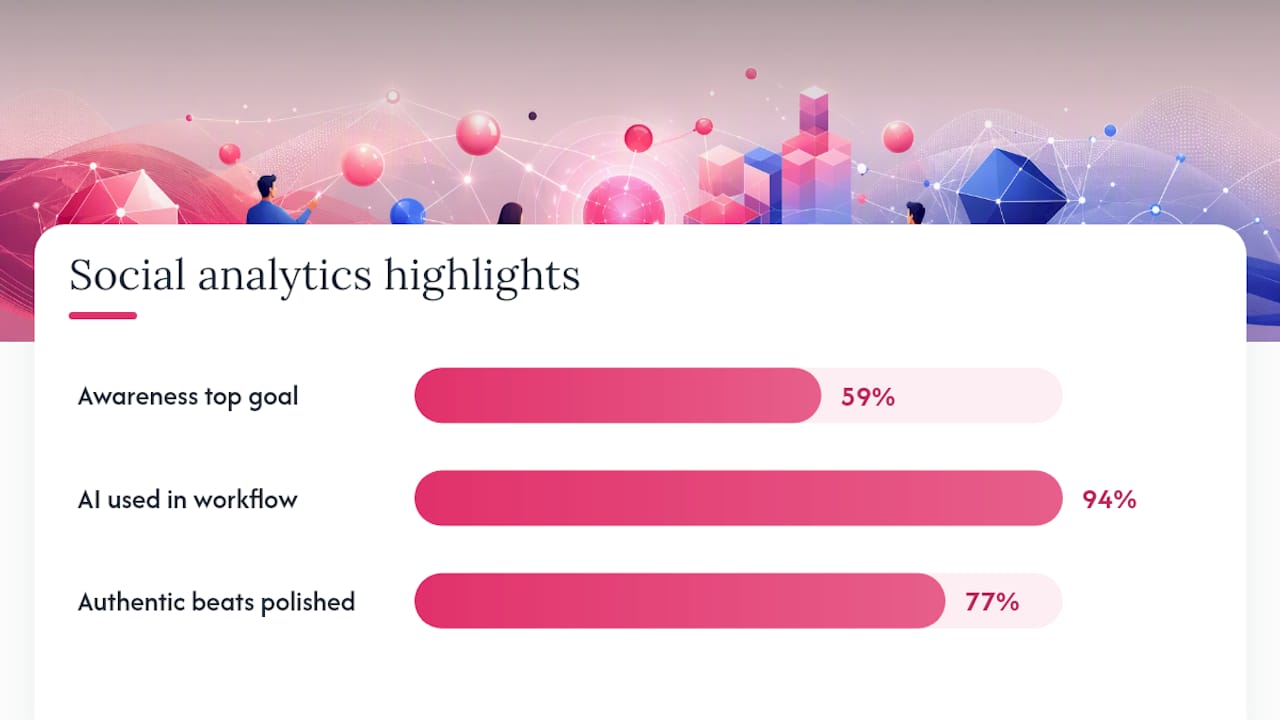
Statistic Callout: 59% of marketers name increasing brand awareness their top goal for 2026, and 94% now use AI somewhere in their social workflow. Awareness remains the dominant use case for analytics, but AI adoption is reshaping how that awareness gets measured and produced.
The gap between collecting data and using it is where most programs fail. A 2025 study on social media reporting found that organizations routinely misalign KPIs with business goals, suffer from low data literacy among the people reading reports, and operate in silos where marketing, sales, and leadership never compare notes on what “success” actually means.
Common mistakes that block analytics from influencing real decisions:
- Reporting reach and impressions without context. A number without a comparison point (last month, last quarter, a target) is decoration, not insight.
- Treating every metric as equally important. A spike in likes on a meme post doesn’t matter if it never touches acquisition or retention.
- Skipping the recommendation. A chart tells you what happened; only a written recommendation tells leadership what to do next.
- Letting platform silos dictate strategy. Comparing Instagram reach to LinkedIn reach without adjusting for audience size or platform norms produces false conclusions.
- Ignoring authenticity signals. 77% of marketers report that raw, authentic content now outperforms polished video on most platforms, yet many teams still measure success by production value instead of resonance.
Fix the recommendation gap first. It’s the cheapest change with the biggest payoff.
Which Social Media Metrics Actually Matter?
Metrics only matter when they’re organized by objective. Tracking everything and reporting all of it produces noise, not clarity. Group your metrics into four buckets: awareness, engagement, traffic and conversions, and community and sentiment.
Awareness metrics
Awareness metrics measure how many people saw your content and how far it traveled.
- Reach: unique accounts that saw your post. Better than impressions for understanding true audience size.
- Impressions: total number of times content displayed, including repeat views. Useful for frequency analysis, misleading if used alone to claim “growth.”
- Follower growth rate: the percentage change in audience size over a period. More meaningful than raw follower count, which can be inflated by bot activity or one viral post.
The metric that’s often misleading here is raw impressions reported without a reach comparison. A single post reshared repeatedly by the algorithm can inflate impressions while reaching the same small pool of people. Pair impressions with reach every time you report either one.
Engagement metrics
- Engagement rate: likes, comments, shares, and saves divided by reach or followers. The most honest signal of whether content resonates.
- Save rate: how often people bookmark a post. A strong predictor of long-term value, especially for educational or reference content.
- Share rate: how often people pass content along. A stronger organic growth signal than likes, since sharing requires more intent.
Likes get reported constantly and mean the least. A save or a share requires a viewer to make a decision; a like requires a thumb.
Traffic and conversion metrics
- Click-through rate (CTR): the percentage of viewers who clicked a link. Ties social content directly to downstream funnel activity.
- Conversion rate: the percentage of clicks that result in a signup, purchase, or lead form completion.
- Cost per result: for paid social, what you’re spending to generate each click, lead, or sale.
Pro Tip: Tag every link you post with a UTM parameter before it goes live, not after. Retroactively tracking a viral post’s traffic is nearly impossible once it’s already been shared across five platforms.
Community and sentiment metrics
- Sentiment ratio: the proportion of positive to negative comments and mentions, useful for catching brand reputation shifts early.
- Response rate and time: how quickly and consistently your team replies to comments and DMs, a strong retention signal.
- Share of voice: how much of the conversation in your category mentions your brand versus competitors.
For a brand-awareness goal, pair reach with sentiment ratio. For a lead-generation goal, pair CTR with cost per result. For a loyalty goal, pair save rate with response time. The KPI you choose should determine which two or three metrics get the spotlight in every report, not the other way around.
How Do You Build an Effective Social Media Report?
A report that changes decisions has five parts: an executive summary, goals and KPIs, platform performance, insights, and recommendations. Skip the last one and the whole document becomes a formality nobody reads twice.
- Executive summary. Three to five sentences stating what happened, whether it hit target, and what you’re recommending. Write this last, but put it first.
- Goals and KPIs. Restate the specific business goal this report serves (leads, awareness, retention) and the metric tied to it. This anchors every number that follows.
- Platform performance. Break down results by channel, since a metric that looks flat overall might be strong on one platform and declining on another.
- Insights. The diagnostic layer. Explain why the numbers moved, not just that they moved.
- Recommendations and next steps. Concrete actions: shift budget, test a new format, increase posting frequency on a specific platform. Reports without clear next steps rarely influence budget or strategy, no matter how clean the charts look.
Cadence should match who’s reading the report. Daily checks make sense during live campaigns or crisis monitoring. Weekly dashboards suit operators who need drill-down detail to adjust posting schedules mid-flight. Monthly reports work for tracking growth trends against goals. Quarterly summaries fit executive audiences who want ROI language, not raw numbers, and comparing week-over-week data for quick pivots versus year-over-year data for strategic evaluation keeps each cadence serving a distinct purpose instead of duplicating effort.
A simple table format works for most recurring reports, showing metrics across periods and changes without specifying exact numbers to avoid unsupported details.
For visualizations, a line chart works best for trend-over-time metrics like reach or follower growth. Bar charts suit platform comparisons. Avoid pie charts for anything with more than three categories; they get unreadable fast and rarely add clarity that a simple table doesn’t already provide.
What Tools and Workflows Support Social Media Analytics?
Choosing a tool stack depends less on budget and more on how many platforms you manage and how often you need to report. Three approaches dominate: native dashboards, third-party aggregators, and custom BI setups.
Native dashboards (Instagram Insights, LinkedIn Analytics, X Analytics) are free and give you the most granular platform-specific data. The catch is that none of them talk to each other. If you manage five platforms, you’re logging into five separate tools and manually copying numbers into a spreadsheet, which invites transcription errors and eats hours every week.
Third-party aggregators and connectors solve the consolidation problem. Tools built around API connectors pull data from every platform into a single dashboard automatically, which is the practical workflow most reporting guides recommend: connect the APIs, route the data into a spreadsheet or BI tool, then layer an executive summary and recommendations on top. This cuts manual reporting time significantly and reduces the friction that causes reports to get skipped entirely during busy weeks.
Custom BI setups (built on tools like Looker Studio or Tableau, fed by the same API connectors) make sense once you’re combining social data with sales or CRM data to prove attribution. They take more setup time upfront but scale well for teams running reports across multiple business units or client accounts.
A practical automation checklist worth setting up regardless of which path you choose:
- UTM parameters on every outbound social link, applied consistently across campaigns so traffic sources don’t get lumped together in your analytics platform.
- Event tags on your website or app to track what happens after the click, not just the click itself.
- Scheduled exports so reports generate automatically on your chosen cadence instead of depending on someone remembering to pull the data manually.
- A shared naming convention for campaigns so cross-platform comparisons don’t require manual cleanup every reporting cycle.
If you’re managing content creation and analytics separately, that’s usually where the workflow breaks down. Reviewing platform-specific engagement patterns like those on Instagram alongside your content calendar makes it much easier to spot which formats are actually earning their spot in the schedule.
How Do You Turn Metrics Into Decisions?
Data becomes useful the moment you attach an experiment to it. Without a structured test, a metric change is just a data point; with one, it’s a hypothesis you can prove or kill.
- Write the experiment template before you post. State the metric you’re testing (save rate, CTR, sentiment), the change you’re making (new format, new posting time, new caption style), and the threshold that counts as success.
- Score every potential test by impact and effort. A test that could move a KPI significantly but takes one afternoon to run beats a test with marginal upside that requires a month of production work. Run the high-impact, low-effort tests first.
- Run the test long enough to trust the result. A single post rarely tells you anything; wait for a comparable sample size, usually five to ten posts under the same conditions, before drawing a conclusion.
- Present results with the recommendation attached. Don’t just report that video outperformed static images by 40%. Recommend shifting the content calendar ratio and state what resource that requires.
- Scale winners deliberately, not permanently. Retest scaled winners periodically since algorithm changes and audience fatigue can erode a format’s performance within a few months.
Pro Tip: Keep a running “experiment log” in a shared doc, not buried inside old reports. Six months from now, you’ll want to know which format tests already failed before you accidentally repeat one.
Testing new formats is one of the fastest ways to generate a decision-ready metric, especially since aspect ratio and format choice directly affect how platforms distribute content. A quick reference for current video aspect ratio standards can save a wasted test cycle on a format that was never going to get proper distribution in the first place.
What Advanced Capabilities Should Mature Teams Consider?
AI, social listening, and CRM integration represent the next tier of investment once basic reporting is running smoothly, but each comes with real limitations worth understanding before you commit budget.
AI adoption in social media workflows is now widespread on the content side. 94% of marketers use AI somewhere in their process, mostly for content ideation, caption drafting, and automated tagging of visual assets. What’s underused is AI for listening and trend detection: only 13.54% of marketers currently apply AI to social listening, which leaves a real gap between how AI gets used and where it could add the most analytical value.
- AI for trend detection scans conversation volume and sentiment shifts faster than manual monitoring, flagging emerging topics before they peak.
- AI for automated tagging classifies incoming content (images, video, comments) by theme or sentiment, which speeds up diagnostic analysis significantly.
- Attribution modeling tries to connect a social touchpoint to an eventual sale, but multi-touch customer journeys make clean attribution rare. Treat attribution estimates as directional, not exact.
- CRM and BI integration connects social engagement data to lead records, letting sales teams see which content a prospect interacted with before a deal closed.
A practical overview of AI-based brand awareness measurement is worth reviewing if you’re weighing whether to invest in this layer now or wait until your baseline reporting is fully stable. For most teams, listening and tagging deliver faster returns than full attribution modeling, which tends to demand more data infrastructure than a lean marketing team typically has in place.
Where Can Marketers Find Ready-Made Analytics Resources?
Closing the loop between content creation and reporting is easier when the same workflow handles both ends. Photofy supports that connection directly, since teams building content inside the platform can move straight from creation to scheduling to performance review without switching tools mid-process.
A few resources worth bookmarking:
- The social media reporting guide and templates walks through report structure with downloadable formats you can adapt immediately.
- The free content calendars give you a starting cadence for planning posts before you ever open an analytics dashboard.
- The Instagram analytics guide for small businesses breaks down platform-specific metrics in plain language.
For agencies and franchise networks managing multiple brand accounts, white-label content management keeps templates and branding consistent across every team member posting on a client’s behalf, which matters as much for clean reporting as it does for visual consistency. When every location or franchisee pulls from the same asset library, the resulting performance data is far easier to compare across accounts, since you’re not accounting for ten different visual styles skewing engagement numbers.
How Do You Collect Reliable Social Media Data?
Data collection happens through three main channels: native platform APIs, third-party connectors, and manual export. APIs offer the most reliable and current data but come with rate limits and occasional access changes when platforms update their developer policies. Connectors simplify multi-platform collection but add a layer of dependency on a third-party service staying compatible with each platform’s API.
Data quality problems usually come from three sources. First, inconsistent time zones between platforms can make day-over-day comparisons misleading if reports aren’t standardized to one time zone before analysis. Second, bot activity and fake engagement inflate raw counts like followers and likes, particularly on paid campaigns targeting broad audiences. Third, attribution windows differ by platform. A conversion window on one channel might count a click within one day, while another counts within seven, which makes cross-platform conversion comparisons unreliable unless you normalize the windows first.
Before trusting any report, check three things: whether the data pull covers a complete period (not a partial day cut off mid-collection), whether the sample size is large enough to draw a conclusion, and whether the metric definitions match across platforms being compared. Reach on Instagram and reach on LinkedIn are calculated differently, and treating them as identical produces a flawed comparison. A ten-minute audit against these three checks catches most reporting errors before they reach a client or an executive.
What Are the Biggest Limitations of Social Media Analytics?
Analytics can tell you what happened and often why, but it rarely tells you the full story on its own. Several structural limitations are worth knowing before you build a strategy that leans too hard on the numbers.
Platform algorithms change without notice, which means a metric that behaved predictably last quarter can shift for reasons that have nothing to do with your content quality. A drop in reach might reflect an algorithm update, not a weaker post. Cross-platform comparison is another persistent problem: engagement rate on TikTok and engagement rate on Facebook aren’t measuring the same underlying behavior, since each platform’s audience expectations and interface design shape how people interact differently.
Attribution remains genuinely difficult. Most customer journeys touch social media at some point, but rarely as the only touchpoint before a purchase, which makes it hard to credit a sale cleanly to one post or campaign. Sentiment analysis tools, including AI-assisted ones, still struggle with sarcasm, slang, and cultural context, so automated sentiment scores need a human spot check before they drive a real decision. And small sample sizes on niche accounts or new campaigns can produce numbers that look dramatic but mean very little statistically.
None of this makes analytics less valuable. It means every number needs context, and every automated tool needs a person checking whether the output actually makes sense before it lands in a report.
What Should Lean Teams Prioritize First?
If you’re running social media analytics solo or on a two-person team, don’t try to build a predictive model in month one. Prioritize three things: a consistent weekly reach and engagement check, one clean monthly report tied to a single business KPI, and a shared naming convention for campaigns so your own data doesn’t become unreadable in six months.
Put your small initial budget toward a connector tool that consolidates platform data automatically, not toward a fancy BI dashboard nobody has time to maintain. Governance matters more than sophistication at this stage: the same report structure, the same metrics, and the same cadence every single time, even when the numbers are unremarkable, builds the habit that eventually earns analytics a seat in real budget conversations.
— Jon
Ready to Close the Loop From Content to Report?
A unified social media platform that combines content creation and reporting in one place avoids exporting from multiple apps just to build reporting tables. Features like pre-designed templates, shared asset libraries, scheduling tools, and brand controls help maintain consistent posting cadence and brand integrity across accounts.
If reporting has been the weak link in your workflow, start with the free content calendars to build a consistent posting rhythm, then explore Photofy’s full platform to see how creation and scheduling connect directly to the metrics you’re already tracking. Agencies managing multiple client brands can also look at white-label branding options built specifically for that kind of scale.
Sources
- HubSpot’s 2026 Social Media Marketing Report: Data from 1100+ Global Marketers
- Social media reporting: How to do it right for strategic decision making
- Social media reporting (Supermetrics blog)