

Engagement Rate Benchmarks for 2026: What Counts as Good
A good engagement rate in 2026 depends on two things: the platform and the denominator. Measured against followers, TikTok averages around 2.50%, Instagram about 0.45% to 0.50%, and Facebook about 0.15%. LinkedIn business Pages sit higher, at roughly 5%, under a different method. Those numbers are only useful if you calculate your own rate the same way, so this guide covers both the benchmarks and the math behind them.
If you manage social media for a small business, a franchise, a direct selling team or a brand with many local reps, you will leave with a clear target for each channel and a method for checking it each month.
TL;DR
- Follower-based averages in 2026: TikTok about 2.50%, Instagram about 0.45% to 0.50%, Facebook about 0.15% (Socialinsider data).
- LinkedIn business Pages averaged 5.20% in Socialinsider’s 2025 data, and multi-image posts led its Q2 2026 update at 6.90%.
- A rate based on reach can look five times higher than the same post measured by followers, so never compare across methods.
- Benchmark against your own last 90 days first, then against your industry and follower band.
- Consistent branded content, published on a schedule, is the most dependable lever you control.
Table of Contents
- What is an engagement rate, and how do you calculate it?
- Why do benchmarks from different sources disagree?
- What are the average engagement rates by platform in 2026?
- What is a good engagement rate for your account size?
- How do you build a benchmark that fits your business?
- Which other content metrics give engagement rate context?
- Our perspective: consistency beats chasing the average
- How can you raise your engagement rate in 2026?
- Where does Photofy fit into your engagement workflow?
- FAQ
- Sources
What is an engagement rate, and how do you calculate it?
Engagement rate is the share of people who interacted with your content, expressed as a percentage. The interactions in the numerator usually include likes, comments, shares and saves. The denominator is where sources disagree.
There are three common versions:
- By followers: interactions divided by follower count. This is the most common because follower counts are public, and it is the method behind most platform benchmark reports.
- By reach: interactions divided by the number of unique people who saw the post. Rates are higher because not every follower sees every post.
- By impressions: interactions divided by total views, including repeat views.
For example, a post with 50 interactions on an account with 10,000 followers has a 0.5% follower-based rate. If only 2,500 people saw it, the reach-based rate is 2.0%. Same post, same results, a four-times difference.
Socialinsider’s methodology shows how much the numerator varies as well. On Instagram it counts likes and comments. On TikTok it adds shares and saves. On Facebook it counts reactions, comments and shares. A headline number from one platform is not directly comparable to another’s.
Why do benchmarks from different sources disagree?
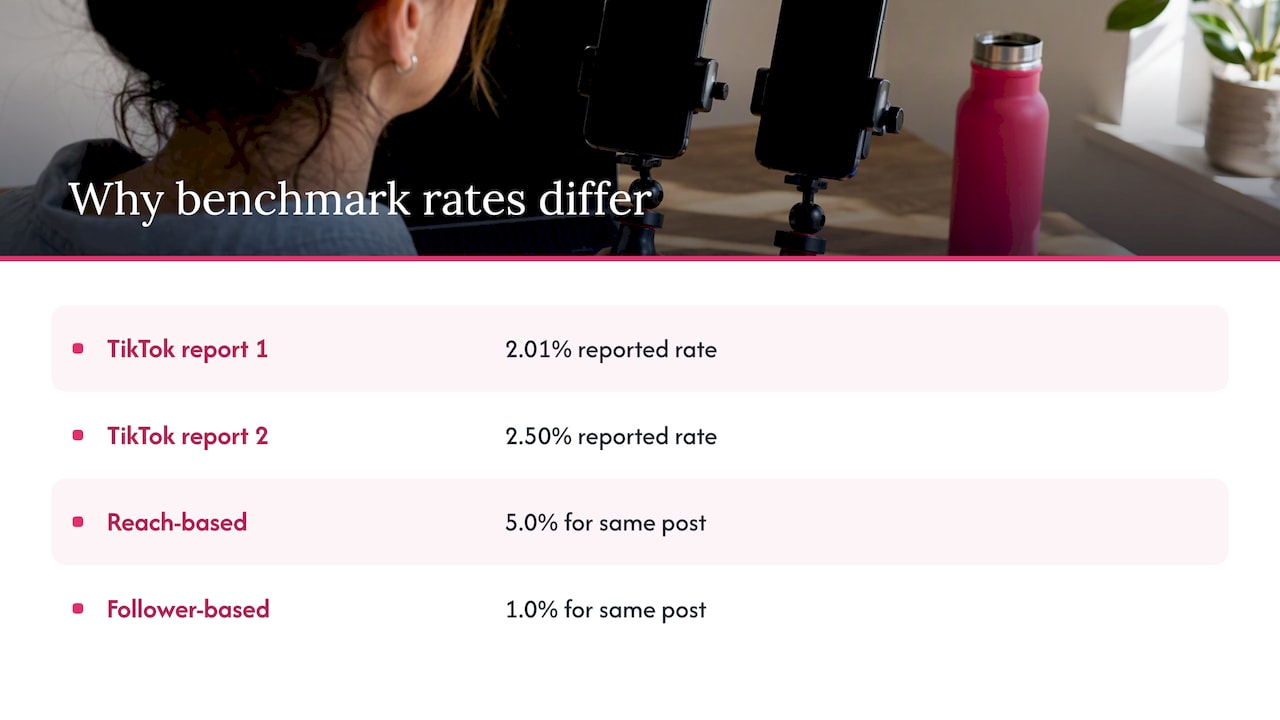
You will see TikTok quoted at 2.01% in one report and 2.50% in another. Neither is wrong. They use different samples, time periods and formulas.
The most common mistake is a mismatch between numerator and denominator. As AdRevival’s Facebook analysis points out, a 5.0% rate based on reach is mathematically the same as 1.0% based on followers for the same post. Before you compare anything, identify what sits above and below the line.
Follower-based benchmarks also have a known weakness. The same analysis notes that pages with large, long-accumulated audiences often carry many inactive followers, which pulls the rate down. A page that has been growing for ten years may look weaker than a new one even when its real audience is just as engaged.
The practical advice from industry benchmark guidance is to standardize your definition of engagement in every report. Write it down once, and use it every month.
What are the average engagement rates by platform in 2026?
Here is a snapshot of what the sources in this guide report. Treat the numbers as ranges, not promises.
| Platform | Reported average | Method and source |
|---|---|---|
| TikTok | 2.50% | By followers, Socialinsider 2026 |
| TikTok | 2.01% | Cross-platform benchmark, Quid 2026 report |
| about 0.45% to 0.50% | By followers, Socialinsider 2026 | |
| 0.15% | By followers, Socialinsider 2026 | |
| LinkedIn business Pages | 5.20% | 2025 data, per a 2026 LinkedIn benchmark roundup |
Two patterns stand out. First, TikTok still tops every platform in the Quid benchmark, ahead of Instagram, Facebook and X by a wide margin. Second, Socialinsider reports that average comments per post fell 24% on TikTok and 16% on Instagram, a sign that audiences are leaning toward passive reactions such as likes and saves.
TikTok
TikTok remains the highest-engagement channel for most brands. Socialinsider’s 2026 figures show it at about 2.50% by followers, with some of its lowest values recorded this year, so expect more competition for attention than in earlier years. If you post short video consistently, 2% to 3% is a realistic target.
Instagram’s average is low in follower terms, about 0.45% to 0.50%, and it has been mostly flat. That means a post at 1% is already well above average for many accounts. Reels usually outperform static posts, and industry-level Reels ranges run from roughly 2% to 5% in categories such as beauty and personal care, which use different calculations than the all-account average above.
Facebook is the most mature channel and the most stable. Socialinsider reports a 0.15% average, and its Q3 2026 reading held at 0.13%. Because the denominator is your follower count, the AdRevival analysis suggests judging the page by reach-based rates as well if your audience is large and older.
LinkedIn business Pages average far more than the consumer platforms. The 5.20% figure describes Socialinsider’s 2025 data, up 8% year over year, not a full-year 2026 result. The newer Q2 2026 update has multi-image posts leading at 6.90%. For B2B teams, that makes carousels and multi-image posts worth testing first.
What is a good engagement rate for your account size?
Smaller accounts usually see higher rates, because a larger share of followers are close to the brand. Several 2026 guides report the same slope: nano and micro accounts often reach 3% to 8% on Instagram, while accounts above 10,000 followers commonly land between 2% and 4% on those creator-focused measures. These are not the same as the all-account averages above, which include inactive and abandoned profiles.
Use this as a rule of thumb:
- Below average: under the platform average in the table above.
- On par: within about 25% of the average.
- Strong: double the average or more.
- Outlier: ten times the average on one post. Study it and repeat what worked, but do not set it as your goal.
The most useful comparison, though, is your own trend. A page that moves from 0.3% to 0.5% on Instagram over a quarter has improved by two-thirds, whatever the industry says.
How do you build a benchmark that fits your business?
Public averages cover millions of accounts across every industry. Yours is one account in one market. Here is a simple process.
- Choose your formula. Pick followers or reach, and apply it to every platform and every month.
- Pull 90 days of posts. Calculate the rate per post, then take the median. The median ignores a single viral outlier.
- Split by format. Compare video, carousel, single image and text posts separately.
- Compare to an outside benchmark of the same type. Match platform, method and, where possible, industry.
- Set a quarterly goal. Aim for a modest lift, such as 10% to 20% above your own median.
- Review monthly. Note which posts beat your median and why.
If you need a reporting structure for this, our social media reporting guide and templates walk through what to include. For the wider picture, measuring digital marketing campaign success shows how engagement connects to the numbers that matter to the business.
Which other content metrics give engagement rate context?
Engagement rate tells you whether people reacted. It does not tell you whether they acted. Pair it with reach, click-through rate, saves, follower growth and, for web content, time on page and conversions. A broader look at content engagement strategies and related measurement metrics can help you decide which supporting numbers belong on your dashboard.
As a reference point for web content, one 2026 roundup of content performance reports puts the average GA4 engagement rate across all industries at 62%. That is a website metric, defined differently from social engagement, so never place it next to a social rate.
Our perspective: consistency beats chasing the average
We work every day with small businesses, direct sellers, franchises and enterprise teams who share content across many people. What we see is that benchmarks matter less than most teams expect. The bigger issue is whether every post looks like it comes from the same brand, goes out on a schedule, and gives the audience a reason to react.
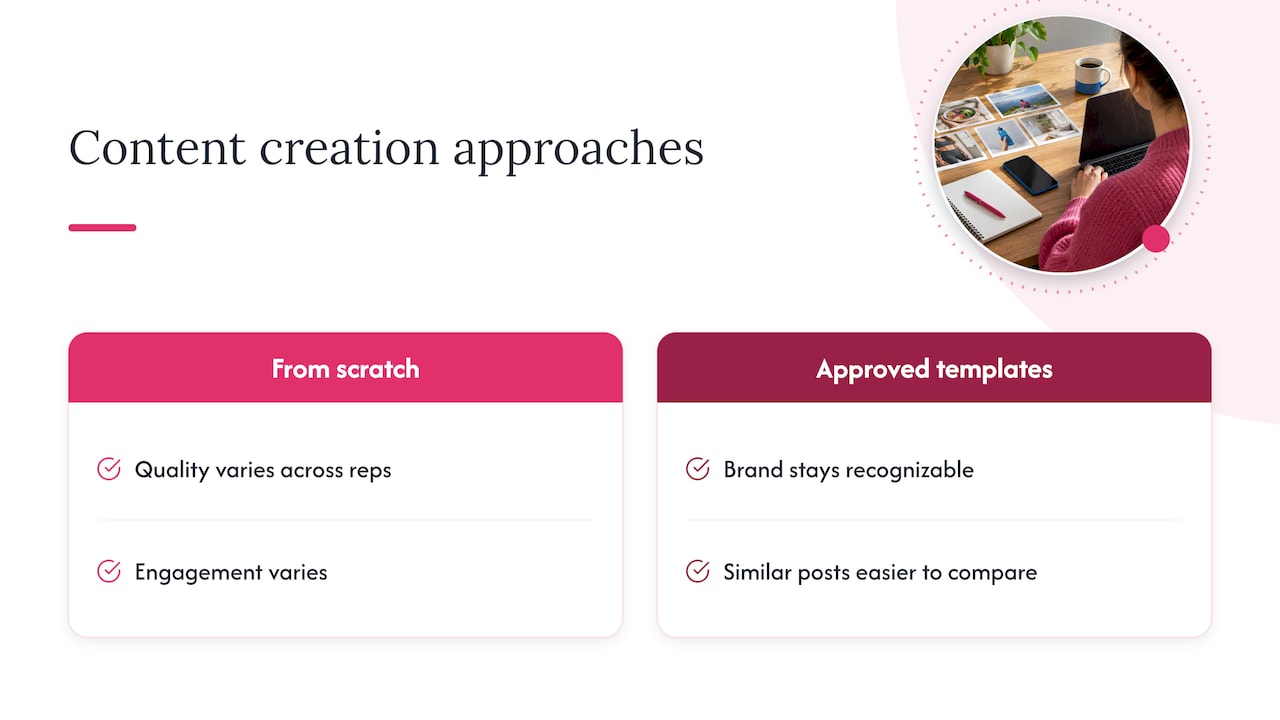
When a franchise or sales network lets every local rep design from scratch, quality varies and so does engagement. When reps work from approved templates they can still personalize, the brand stays recognizable, and the numbers are easier to read, because you are comparing similar posts. That is the principle behind how we built Photofy: templates, an asset library, scheduling and analytics in one place, with white-label options for larger organizations.
Our advice is simple. Pick one formula, record your baseline, and improve one variable at a time: format, posting time, or visual style. A steady 20% gain beats a one-off spike every time.
— Jon
How can you raise your engagement rate in 2026?
Once you know your baseline, these changes tend to move the number most.
- Lead with video on TikTok and Instagram. Short video sits at the top of the benchmark tables above.
- Use carousels on LinkedIn. Multi-image posts led the Q2 2026 data.
- Invite a reaction. With comments declining, a clear question or a save-worthy tip gives people an easy way to respond.
- Keep your visual identity consistent. Recognition builds the familiarity that drives repeat interaction.
- Post on a schedule. Regular publishing gives you cleaner data and steadier reach.
- Let your team contribute. Employees and local reps often get more interaction than a central brand account. See our comparison of employee created and employee generated content.
For deeper playbooks, read how to achieve high engagement on social media and 20 high engagement strategies for businesses.
Where does Photofy fit into your engagement workflow?
Photofy helps you create branded photos, video and graphics from pre-designed or custom templates, schedule them, and track results, on iOS, Android and desktop. Our Small Business plan is $10.99 per month or $99 per year, and you can see the Small Business plan for details. Individual plans, Pro Teams at $13.00 per month per user and Enterprise Teams at $9.00 per month per user are listed on our plans page. Franchise, direct selling and enterprise programs are arranged through our pricing page.
FAQ
What is a good engagement rate on Instagram in 2026?
By followers, the platform average is about 0.45% to 0.50%, according to Socialinsider. Anything above 1% is strong for most business accounts. Small accounts under 10,000 followers often see more, so compare yourself with accounts of similar size.
Is a 1% engagement rate good?
It depends on the platform and method. On Facebook it is more than six times the 0.15% follower-based average, and on Instagram it is roughly double. On TikTok it is below the 2.50% average, and on LinkedIn it is well under the business Page average.
Should I calculate engagement by followers or by reach?
Use followers when you want to compare against public benchmarks, since most are built that way. Use reach to judge how a specific post performed with the people who saw it. Pick one for your monthly report and keep it, since mixing the two gives misleading comparisons.
How often should I check my engagement rate?
Review it monthly, using the median of the last 90 days of posts. Weekly checks tend to react to noise, while quarterly checks miss problems too late. Note any changes in format or posting frequency alongside the numbers.
Sources
- Socialinsider: Social Media Benchmarks for 2026
- Quid: 2026 Social Media Industry Benchmark Report
- AdRevival: Good Engagement Rate on Facebook, 2026 Benchmarks
- Extrovert: LinkedIn Engagement Rate Benchmarks 2026
- InfluencerDB: Social media benchmarks by industry
- SHNO: Content Performance Benchmarks for 2026