

Franchise Marketing Analytics: What to Track and How
Franchise marketing analytics is the practice of measuring what marketing produces at every location and across the whole network, so franchisors and franchisees can decide where the next dollar goes. It works when everyone uses the same definitions, the same few metrics and content that is consistently branded and trackable from the start. This guide shows what to measure, how to attribute results across corporate, co-op and local campaigns, and how to share the numbers with franchisees in a way they trust.
TL;DR
- Track a short list per location: leads by source, cost per lead, conversion rate, first response time and revenue produced. Add network totals on top.
- Separate brand-level (national) results from local results, then use multi-touch attribution once your data is clean. Start simple with last-touch if you are new to this.
- Set benchmarks as ranges and cohorts, not one flat target, so a highway-side unit and a downtown flagship are judged fairly.
- Agree on one data dictionary before building dashboards. One wrong location number can make franchisees doubt the whole system.
- Review weekly for operations, monthly for financials and quarterly for strategy.
Table of Contents
- What does franchise marketing analytics measure?
- Which metrics should you track at the location level?
- What should the network see?
- How do you attribute results across corporate, co-op and local campaigns?
- How do you benchmark locations fairly?
- How do you build reporting franchisees will use?
- What are the four types of marketing analytics?
- Where content fits into franchise analytics
- Put your content and measurement on one platform
- Our perspective
- FAQ
- Sources
What does franchise marketing analytics measure?
It measures how marketing activity turns into customers and revenue, at two levels at once. The network level answers whether the brand’s investment is working overall. The location level answers whether this franchisee’s local effort is working.
That double view is what makes franchise analytics different from ordinary small business reporting. One franchise guide separates national ROI metrics (brand awareness and reach, systemwide lead generation, overall customer acquisition cost) from local ones (local ad performance, new customers by location, local conversion rates, repeat visits). Mixing them produces numbers nobody can act on.
The benefit goes both ways. Franchisors see which markets, channels and creative earn their budget. Franchisees see how they compare with the system and what to copy from the best locations.
Which metrics should you track at the location level?
Start with a few honest numbers rather than a wall of charts. A franchise marketing dashboard should show five metric families per location: visibility, leads and their source, response and follow-up, lead quality and conversion, and revenue. Blended into a single network figure, they hide the differences a franchise leader needs to act on. The same source suggests a starting five: one visibility metric, lead count with source, first response time, lead-to-customer conversion and revenue produced.
Other commonly recommended location KPIs, from a multi-location KPI guide, are:
- Cost per lead, segmented by channel and location
- Conversion rate by channel
- Store visit attribution
- Marketing-attributed revenue
- ROAS or ROI by campaign
Lead quality now matters more than raw volume. 1851 Franchise reports that lead quality, lead volume and appointment generation are the most important metrics today, and that falling website traffic, as consumers use AI tools for research, does not automatically mean fewer opportunities.
Why cost per lead alone can mislead
Cost per lead is easy to read and easy to misuse. A worked example shows why. A channel producing $20 leads that convert at 5% has a $400 cost per acquisition. A channel producing $50 leads that convert at 15% costs $333 per acquisition. The more expensive leads win.
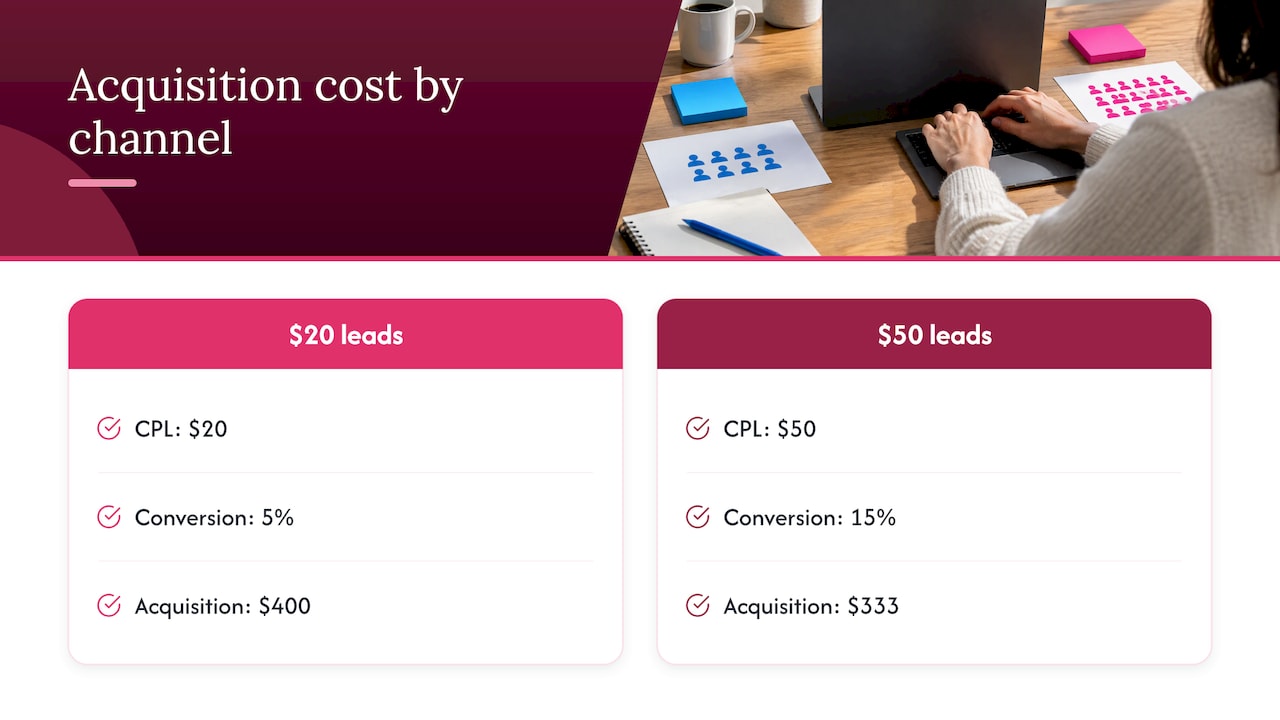
The same source adds a spending rule based on lifetime value: a customer worth $2,100 over their lifetime justifies a $150 acquisition cost, while a customer worth $200 does not. So track cost per lead, then judge it against conversion and customer value.
Local variance is real, too. In a Florida example from the same source, Google Local Service Ads averaged $18 per lead across three locations in 2025, but the individual locations ranged from $12 to $31. Tightening the targeting at the $31 location brought it to $21 within two weeks.
What should the network see?
Franchisor leadership needs fewer, higher-level figures. According to a dashboard build guide, the network view should show total revenue, same-store growth, marketing spend, cost per lead, and which locations sit above and below target. System-wide measures such as average revenue per location and marketing spend as a percentage of revenue help you see whether marketing investment tracks with location performance, and which top performers’ practices are worth sharing.
A useful way to organize this is by dashboard level:
| Dashboard | Who reads it | Main question |
|---|---|---|
| Network | Franchisor leadership | Is the system growing, and where are we above or below target? |
| Region | Area managers | Which markets need help? |
| Location | Franchisee | Are my leads, calls and revenue on track? |
| Marketing fund | Marketing team and franchisees | Is shared marketing money working for every location? |
The four levels follow the structure recommended in the same build guide. Give each reader one question to answer, and the dashboard stays useful.
How do you attribute results across corporate, co-op and local campaigns?
Franchise customer journeys cross boundaries. A person sees a national TV ad, searches on Google, clicks a local ad and visits a different location than the one you expected. Standard attribution models break down in that case, which is why the recommended approach is multi-touch attribution that shares credit between national and local touchpoints, with unified tracking across digital and offline channels.
You do not need to start there. A practical path:
- Start with last-touch attribution. It is simple and quick to set up for a new analytics program.
- Move to multi-touch as your data matures and you run several channels.
- Separate brand-level and local-level spend so corporate media, co-op fund disbursements and franchisee local spend are each visible.
- Track calls. Phone calls are a primary local conversion, and per-location, per-channel tracking numbers let you tie calls to campaigns, keywords and locations.
Call tracking pays off at scale. Griswold Home Care assigned tracking numbers to each of its 200+ locations so it could associate calls with marketing activities and see how each location performed. In another case study, the franchised hearing-aid organization Miracle-Ear reported that about 80% of its digital conversions happen over the phone, which is why phone data cannot be an afterthought.
If you want a broader look at joining up tracking across channels, this overview of analytics and marketing ROI is a good companion read.
Co-op funds and digital measurability
Digital co-op programs, where franchisees spend co-op funds on search ads, social, local SEO, email and reputation management, are easier to measure than direct mail or print. Whatever the channel, every dollar should be tagged to a location and a campaign, or the fund dashboard cannot answer its question.
Incrementality: the next step
Attribution tells you who touched a customer last or most. Incrementality asks a harder question: which channels create new demand, and which simply capture demand that already existed? 1851 Franchise reports that most franchise teams need marketing analyst firms or software to do this well, so treat it as a second-stage goal.
The International Franchise Association describes three maturity tiers: campaign output (sends, opens, clicks), business outcomes (attributed revenue, traffic lift, conversion rates with franchisee-level visibility), and network intelligence, where the network itself becomes a built-in test-and-control group. Most networks are best served by moving from the first tier to the second before aiming at the third.
How do you benchmark locations fairly?
A flat target punishes some locations and flatters others. As one KPI guide puts it, you cannot hold a highway-side franchise in Iowa and a downtown Los Angeles flagship to the same cost per lead or ROAS target. Its recommendations are practical:
- Segment locations by geography, store maturity and traffic patterns.
- Group them into cohorts, for example high-, medium- and low-traffic.
- Use ranges instead of fixed numbers, such as a target cost per lead of $8 to $12 rather than exactly $10.
Franchisees should see their own results against the system average and top-quartile performers, with other locations anonymized, as Franchise Promo recommends. One case study of a 75-owner network showed the system as a benchmark rather than a leaderboard, with a data dictionary that let any owner see exactly how each metric was calculated. That framing builds trust, and trust is what gets franchisees to act on the numbers.
How do you build reporting franchisees will use?
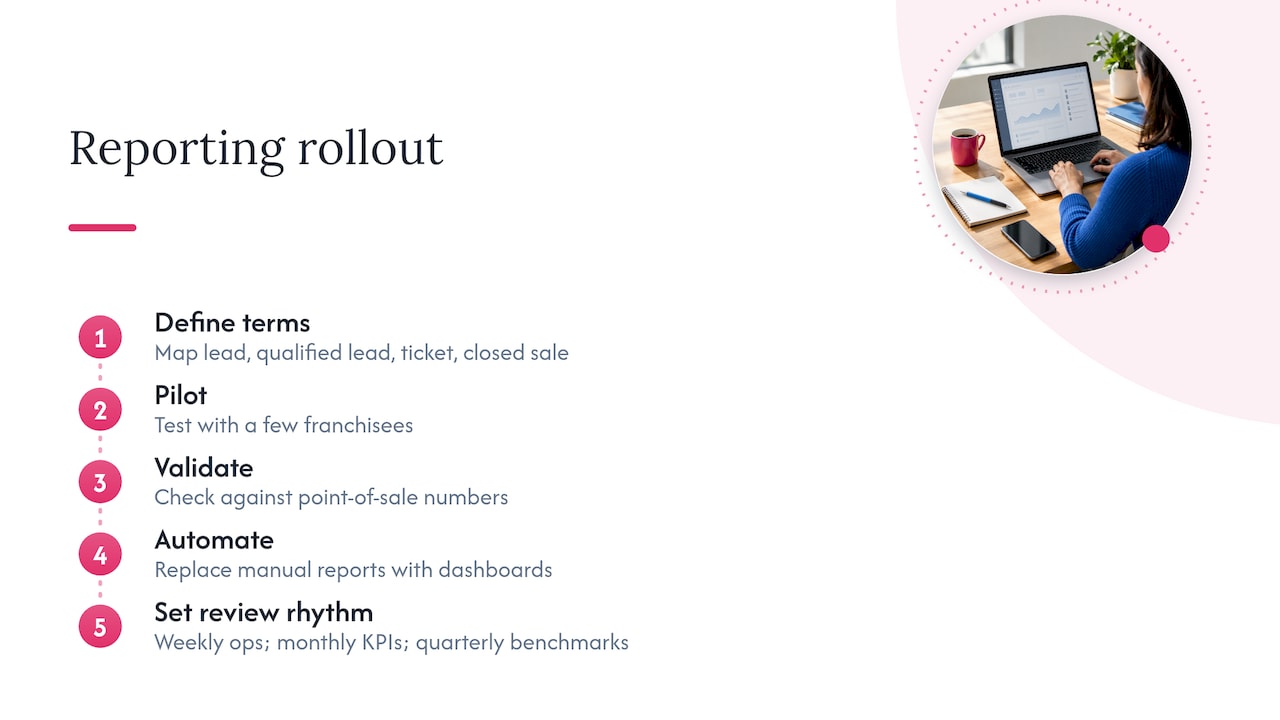
The hardest part is rarely the chart. It is agreeing on what a “lead” is. A canonical data dictionary maps each source system’s version of lead, qualified lead, ticket and closed sale to one shared definition. Pilot it with a few franchisees and check it against their own point-of-sale numbers before network-wide rollout. One incorrect location dashboard can convince a skeptical network that the whole system is unreliable.
Then automate. Manual reporting introduces errors and eats time. In one case, a franchise group that consolidated data from six CRMs across ten brands moved from a monthly static PDF to near-real-time dashboards and shifted cross-channel analysis from monthly to weekly meetings.
Set a rhythm as well. A franchise analytics guide suggests weekly operational reviews, monthly financial and KPI reviews and quarterly strategic benchmarking, and warns that monthly-only reporting arrives too late to be useful.
What are the four types of marketing analytics?
The four types describe how far an analysis goes, and each applies directly to a franchise, according to a franchise business review:
- Descriptive: what happened, such as a sales dip or differences between locations.
- Diagnostic: why it happened, such as one location outperforming because its largest competitor closed.
- Predictive: what to expect, such as higher holiday-season sales based on past patterns.
- Prescriptive: what to do, such as investing more in a specific channel.
Most networks spend their first year on descriptive and diagnostic work. Predictive models need history: Franchise Promo notes that after six or more months of location-level data, a network can forecast which locations will respond best to more ad spend and which channels are nearing saturation.
Where content fits into franchise analytics
Analytics only compares locations fairly when the thing being compared is consistent. If every franchisee builds posts from scratch, you cannot tell whether a result came from the offer, the creative or the market. Shared, approved, brand-safe content gives you a controlled baseline and lets local teams add their own touch. Our guides on distributed marketing, content ideas for franchises and a 30/60/90 plan for franchise social media show how to set that up. For the measurement basics behind any campaign, see how to measure the success of a digital marketing campaign.
Put your content and measurement on one platform
Photofy brings branded content creation, scheduling, analytics and white-label content management together for franchises, direct selling brands and enterprise teams. Pre-designed and custom templates and a stock asset library help every location publish on-brand content quickly, and the platform gives you measurable results on your social marketing efforts. It runs on iOS, Android and desktop.

Small Business is $10.99 per month or $99 per year at Photofy Small Business. Team plans are listed at $13.00 per month per user for Pro Teams and $9.00 per month per user for Enterprise Teams on the Photofy plans page. Franchise and enterprise solutions are arranged by direct inquiry through the Photofy pricing page.
Our perspective
We believe franchise analytics starts before the first report. When every location posts from the same approved templates and assets, your results become comparable, and your franchisees spend their time on local reach rather than redesigning a post.
That is why we built Photofy around one platform for branded content, team approvals, asset management and publishing. Local reps create authentic, compliant content quickly, and you keep brand control across the network. White-labeling and industry-specific template libraries let the experience carry your own brand.
Our advice: pick five numbers per location, define them once, and review them on a steady rhythm. Then give your franchisees content that is ready to use and easy to publish, so the numbers reflect their effort rather than their design time.
Jon
FAQ
How many metrics should a franchise location dashboard show?
Five is a strong starting point: one visibility metric, lead count with source, first response time, lead-to-customer conversion and revenue produced. Fewer, well-defined numbers are easier for franchisees to trust and act on than dozens of blended ones.
What is the difference between national and local marketing metrics?
National metrics cover brand awareness, systemwide lead generation and overall customer acquisition cost. Local metrics cover ad performance, new customers, conversion rates and repeat visits at one location. Track them separately, then connect them through multi-touch attribution.
What is the 7-step marketing analytics process?
Define business objectives, identify key metrics, collect and integrate data, analyze it, generate insights, make decisions and implement them, then monitor and iterate. For a franchise, the cycle repeats at network and location level, so each review informs the next campaign.
How often should franchise marketing results be reviewed?
Use a layered rhythm: weekly operational reviews, monthly financial and KPI reviews and quarterly strategic benchmarking. Weekly checks let you shift budget while a campaign is still running.
Sources
- Multi-Location Marketing KPIs Guide
- Franchise Marketing Analytics: From ROAS to Incrementality
- How to Track Franchise Marketing ROI with Data Analytics
- How Do Franchisors Measure Franchise Marketing Performance and ROI
- Franchise Marketing Dashboard: Metrics by Location
- Franchise Reporting Dashboard: A Data Studio Build Guide
- Franchise Marketing Guide 2026
- Marketing Analytics for Franchise Brands
- Griswold Home Care case study
- Miracle-Ear case study
- The Confidence Gap, International Franchise Association
- 4Ever Young case study
- Data, Reporting & Analytics for Franchise & Multi-Unit
- Home Franchise Concepts case study
- Franchise Analytics: The Complete Guide
- Leveraging Data Analytics for Franchise Growth
- Why analytics in marketing drives better ROI